Kaizen AI Chat

Connect field activity to sales outcomes.

Talk directly with your connected sales and CRM data. Ask Kaizen AI Chat to compare face-to-face calls and omnichannel contacts with your call plan, find patterns in sales, or flag accounts that may be at risk. Follow up by account, territory or product in the same conversation.

DEMO WITH SAMPLE DATA · JAN–JUN 2026

Your commercial analytics companion

“Which accounts changed course this year, and how did calls and sales move month to month?”

Recorded calls by quarter

  • Westgate Metro General Hospital

    Q129
    Q251

    Calls and sales generally moved together

  • Willow Creek East Regional Hospital

    Q139
    Q274

    Calls and sales generally moved in opposite directions

  • Aspen East General Hospital

    Q142
    Q269

    No sales recorded

Kaizen compared monthly calls and sales over six months. These patterns show where to look next. They don’t tell you what drove the change.

ILLUSTRATIVE EXAMPLE · SAMPLE DATA

Which accounts should I prioritize this cycle?

Ask Kaizen to flag accounts at risk and explain what changed. Here’s how it can bring sales, face-to-face visits and other CRM contacts into one answer.

Sales and other contacts are compared with the previous cycle.

What can you ask Kaizen?

Field activity, call plans and account risk

See which accounts are behind on planned calls

“Which priority accounts are behind on planned calls, and how are sales trending there?”

Compare planned and completed activity and see where gaps in coverage coincide with changes in sales.

Compare the contact mix

“How does the mix of face-to-face calls and other contacts differ across accounts with rising and falling sales?”

Compare face-to-face calls, events and rep-triggered emails to see which patterns merit a closer look.

Investigate changes in activity and sales

“Which accounts had more calls this quarter while sales fell?”

Review monthly trends alongside account activity and check whether the product mix or gaps in recorded data could explain the pattern.

Flag accounts at risk

“Which priority accounts should I review before the next cycle, and why?”

Look for warning signs such as falling sales, missed planned calls or a drop in contact, then ask what changed at each account.

Sales and portfolio performance

Review the sales cycle

“Analyze my sales data for this sales cycle.”

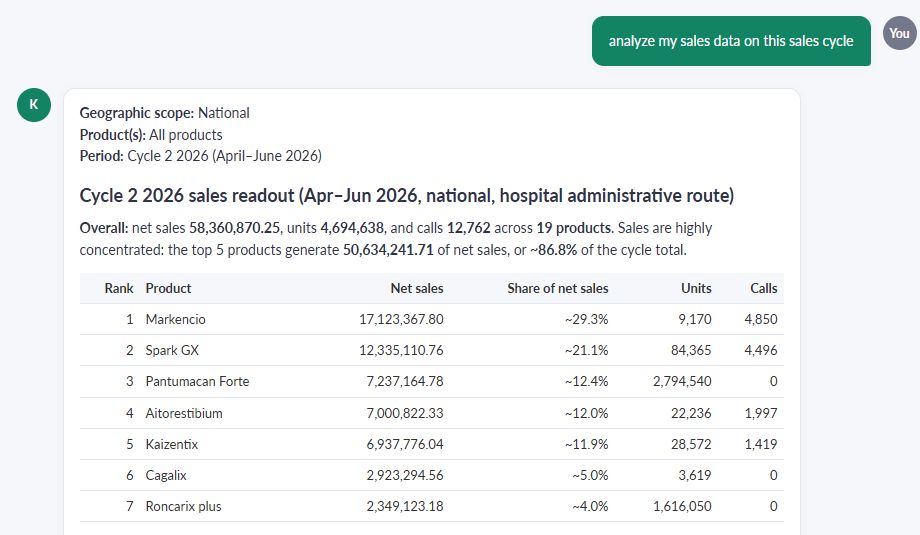
See net sales, units and recorded field visits by product. Identify where sales are concentrated and where activity data is incomplete.

Prepare for the next cycle

“Which accounts and products should I prioritize next cycle?”

Use the previous cycle to identify accounts and products to review. The answer flags where a breakdown by account and product is needed to validate the priorities.

Compare portfolio trends

“How have the top five products in our portfolio performed this year?”

See monthly net sales for the five leading products and identify changes to investigate, such as a sharp increase from a low starting point.

Spot changes by hospital

“Which hospitals saw a change in sales trends over the last few months?”

Compare two periods to see which accounts moved up or down, with the dates and limits of the comparison stated in the answer.

Explore the figures behind each answer.

Review the underlying chart or table, export results to Excel, and ask a follow-up. A sales cycle summary can be a starting point for checking account coverage or comparing contact channels.

From a sales review to next-cycle priorities.

Key observations

50.5%of net sales came from two products

Markencio and Spark GX together account for about 50.5% of net sales. Markencio alone accounts for about 29.3%.

Read full answer ↗

Key observations

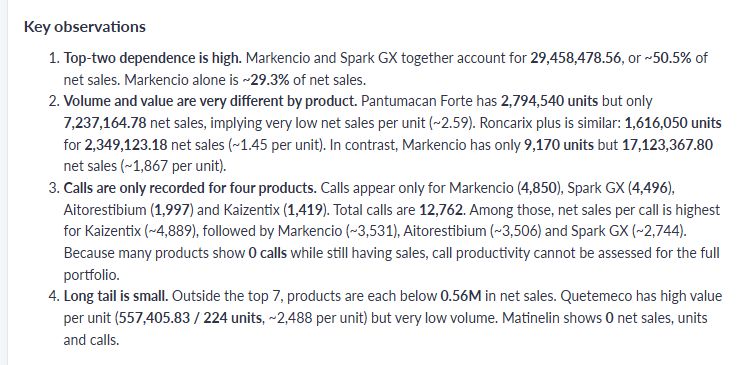
  1. Top-two dependence is high. Markencio and Spark GX together account for 29,458,478.56, or about 50.5% of net sales. Markencio alone accounts for about 29.3%.
  2. Volume and value vary by product. Pantumacan Forte sells 2,794,540 units for 7,237,164.78 in net sales, or about 2.59 per unit. Roncarix plus sells 1,616,050 units for 2,349,123.18, or about 1.45 per unit. Markencio sells 9,170 units for 17,123,367.80, or about 1,867 per unit.
  3. Calls are recorded for only four products. The 12,762 calls are split across Markencio (4,850), Spark GX (4,496), Aitorestibium (1,997) and Kaizentix (1,419). Net sales per call are highest for Kaizentix (about 4,889), followed by Markencio (3,531), Aitorestibium (3,506) and Spark GX (2,744). Many other products show sales with zero recorded calls, which limits the comparison.
  4. Sales outside the top seven are small. Each product outside the top seven brings in less than 0.56 million in net sales. Quetemeco brings in 557,405.83 from 224 units, or about 2,488 per unit. Matinelin shows zero net sales, units and calls.

Recommended next-cycle focus

2 accountsto review first

Prioritize Cypress East University Hospital and Bayview East Regional Hospital. Both are well ahead of the other accounts and already carry 19 products.

Read full answer ↗

Recommended next-cycle focus

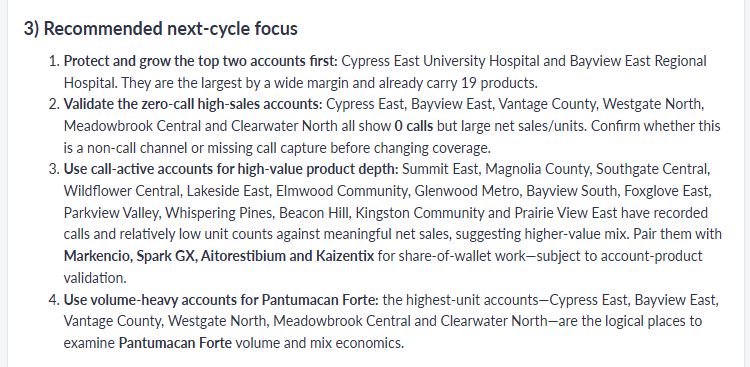
  1. Protect and grow the top two accounts. Cypress East University Hospital and Bayview East Regional Hospital are the largest accounts by a wide margin and already carry 19 products.
  2. Validate high-sales accounts with zero recorded calls. Cypress East, Bayview East, Vantage County, Westgate North, Meadowbrook Central and Clearwater North all show zero calls but high net sales and units. Check whether they use a channel without calls or whether calls went unrecorded before changing coverage.
  3. Review high-value products in accounts with recorded calls. Summit East, Magnolia County, Southgate Central, Wildflower Central, Lakeside East, Elmwood Community, Glenwood Metro, Bayview South, Foxglove East, Parkview Valley, Whispering Pines, Beacon Hill, Kingston Community and Prairie View East show relatively low unit counts against meaningful net sales. Review opportunities for Markencio, Spark GX, Aitorestibium and Kaizentix after validating sales by account and product.
  4. Review Pantumacan Forte in the highest-volume accounts. Start with Cypress East, Bayview East, Vantage County, Westgate North, Meadowbrook Central and Clearwater North when examining volume and product mix.

Sales cycle summary

Kaizen AI Chat answers a question about the current sales cycle with a national product ranking by net sales, units and calls.

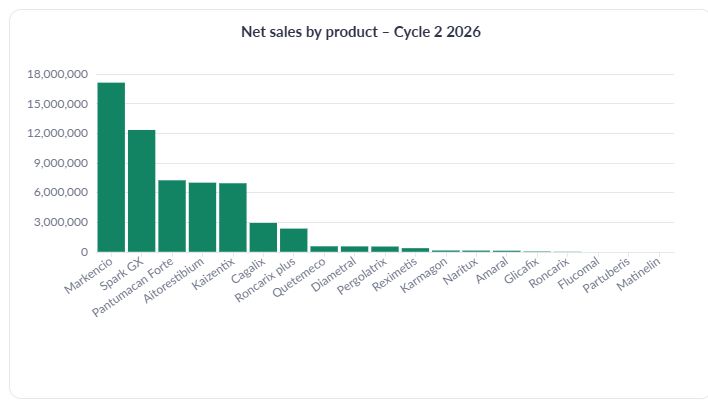
Net sales by product

Bar chart in Kaizen AI Chat showing net sales by product for the second sales cycle of 2026.

YOUR NEXT STEP

See Kaizen AI Chat in action.

See how Kaizen AI Chat brings together your call plan, face-to-face and omnichannel activity, and sales outcomes.